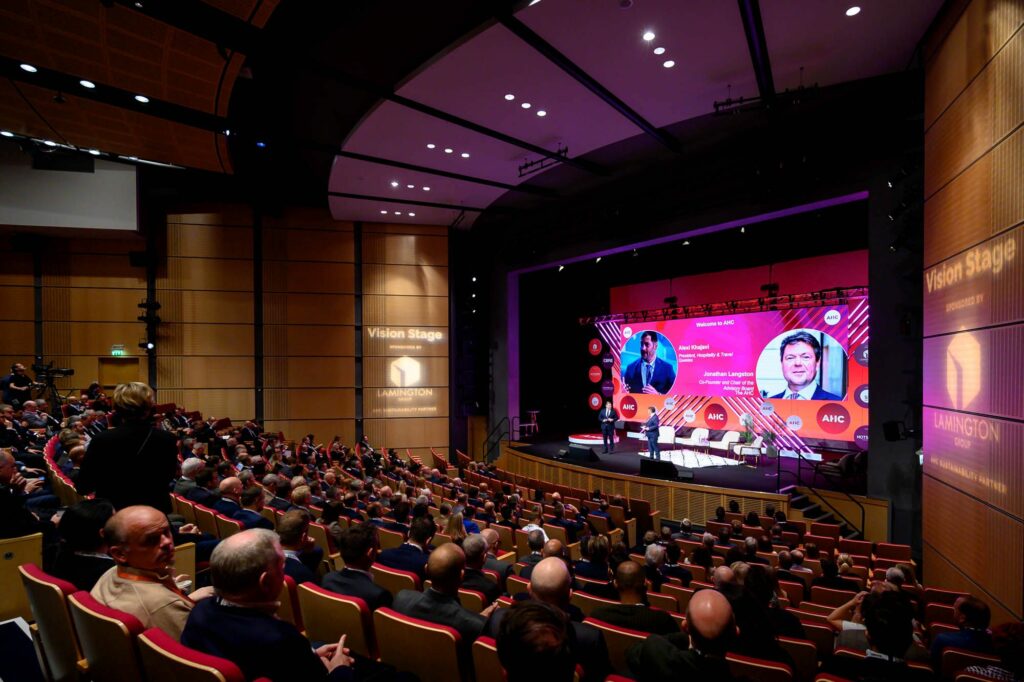
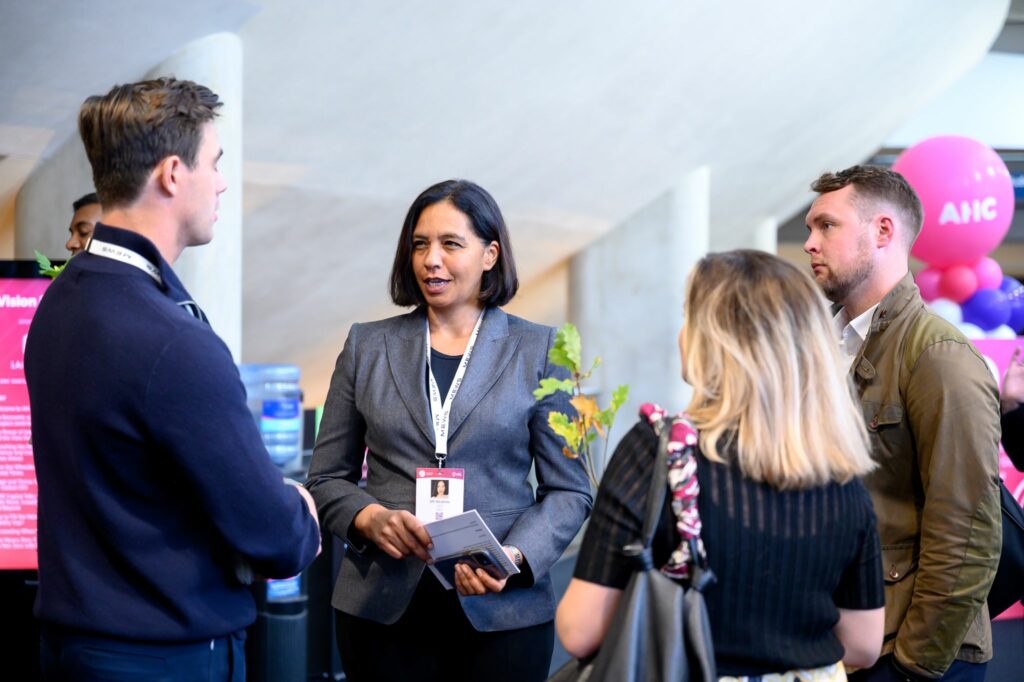
VenuIQ recently returned from the Manchester Central Convention Complex supporting Questex to deliver the Annual Hotel Conference (AHC) 2022.
More than 1000 delegates attended from 250+ hotels representing around 50 brands around the world. These were record-breaking on-site attendance figures which alongside the largest number of exhibitors ever made this a great post-pandemic event.
Questex, the event producer of the AHC, asked VenuIQ to assist with event technology to prove how effective their event was. They required something that would impress delegates, exhibitors, and sponsors.
How did we do this?
- We collected data… and A LOT of it! Close to two billion lines of location-based data from our Bluetooth tracking solution.
- We processed this data into manageable live reports to discover how many people were on-site, where was most popular, and how well sessions were attended.
- Visual representation of behavioural data from which we could see how people moved around the show. Knowing where was popular allows information-based conclusions to be drawn.
- We provided stand traffic and dwell time, seniority averages, demographics and more on each stand grouping.
Our live heat mapping technology provided by beacon-wearing guests produced the following heat maps. These show live data at any point during the conference and allow for real-time decision-making as well as post-event reports and analysis.
Look at the heat maps below:
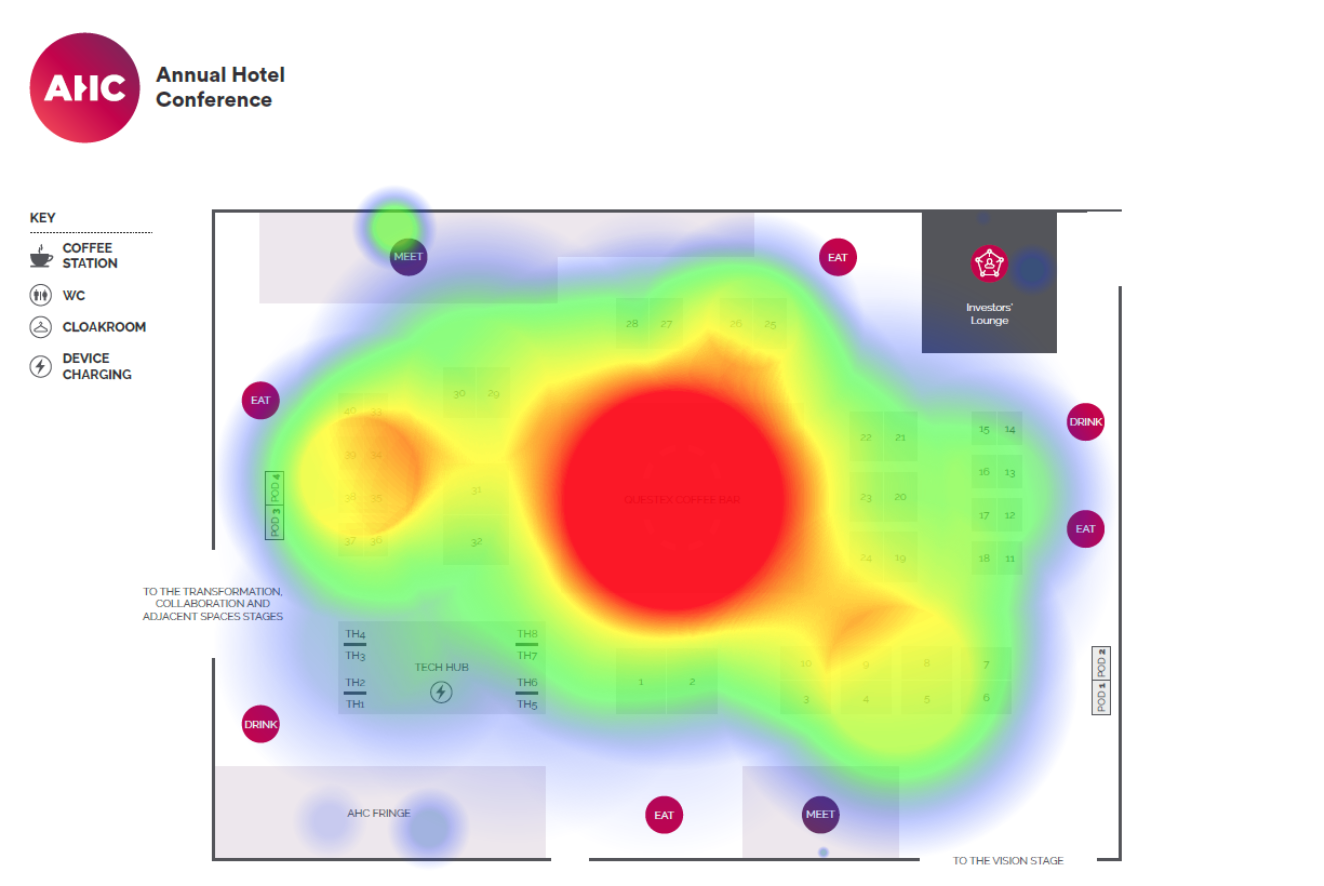
In the morning, you can clearly see that delegates were after ONE THING and one thing only… the sweet nectar of COFFEE!
How can this information be used to make the event more effective next year?
- Tell sponsors and exhibitors that the coffee bar is the place to be!
- Prove the ROI of sponsoring the coffee stand!
- Design product activations around a solid trend
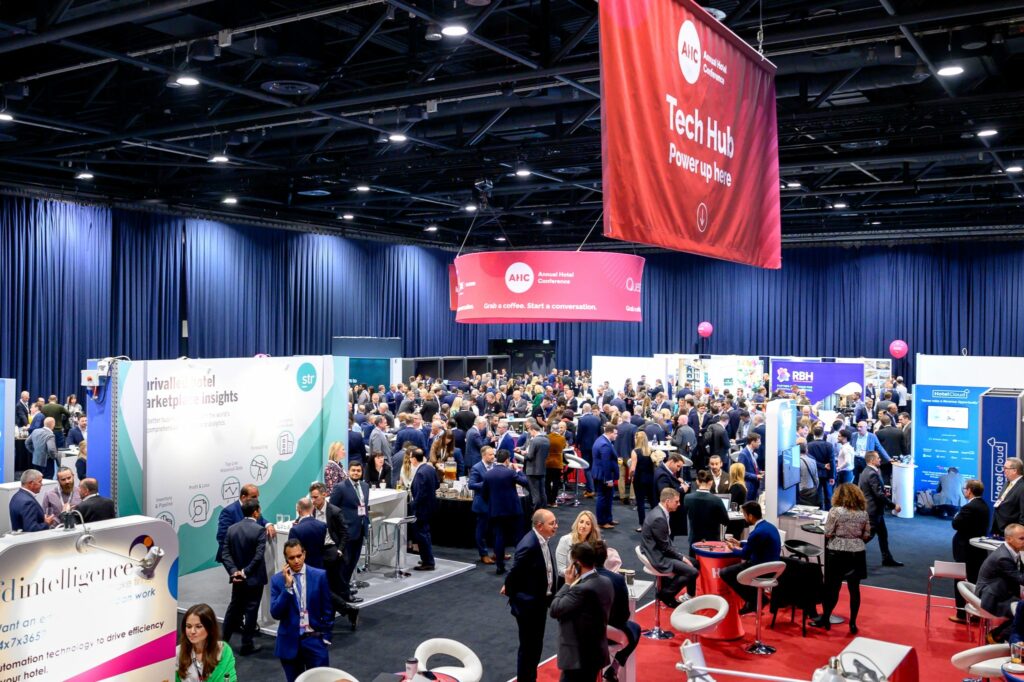
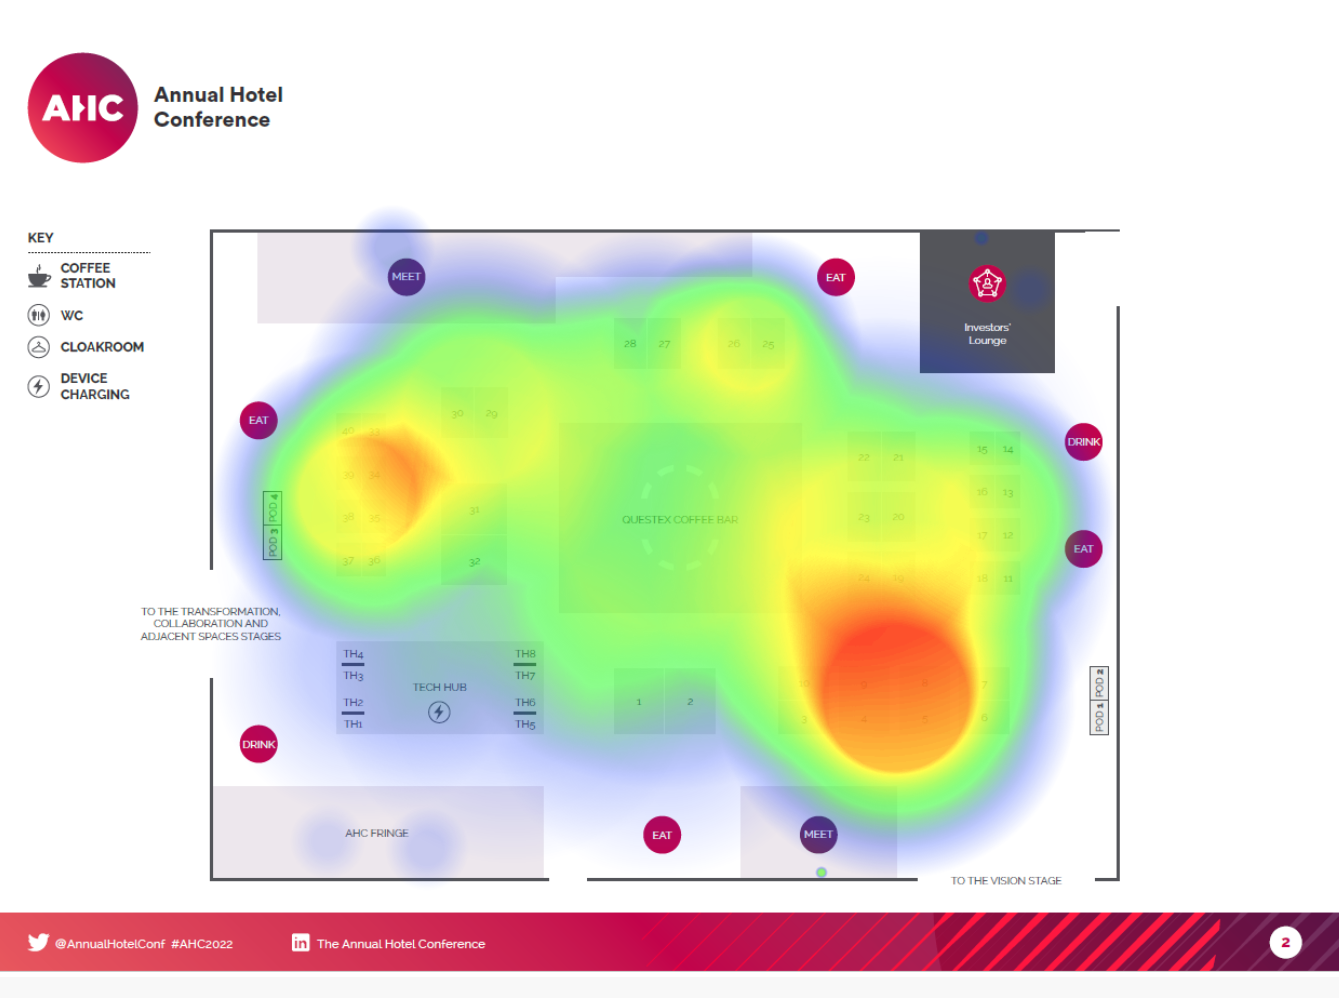
The second heat map shows an even spread of traffic and dwell time around the exhibition floor. How does this help inform next year?
- Does stand location matter that much in their planning of sponsorship packages? Here you can see that the stands near the entrance got the most traffic.
- This ‘hotter’ area did have some activations for beer and spirits. Something we all know is an alluring proposition at 3-4pm after a day onsite!
- Though location benefits could be relevant, you can clearly see more people can fit onto larger stands.
Summary
Questex has more information now than they’ve ever had before. They can prove where guests went, when, and for how long.
This information can be used to let speakers know how many people attended their sessions, how many people visited an exhibition stand and provide reports for all event stakeholders.
For future planning, Questex can use the data provided by tracking to plan their conference for the future. With this data they can make plans to adjust layouts, change stand pricing, timings, and session timings to make their event better for guests, exhibitors, sponsors, and speakers.
“The experience we deliver to our delegates, speakers and sponsors at our events is hugely important to us at Questex, which is why we have engaged with VenuIQ. Everything we do is driven by data – VenuIQ presented us with tangible information about our AHC audience, which in turn informs our planning and decision-making to improve the event next year. The heat maps are a particular favourite.”
Leah Braithwaite
Marketing Director – Operational Real Estate, Questex
You must be logged in to post a comment.